The Economies Past website
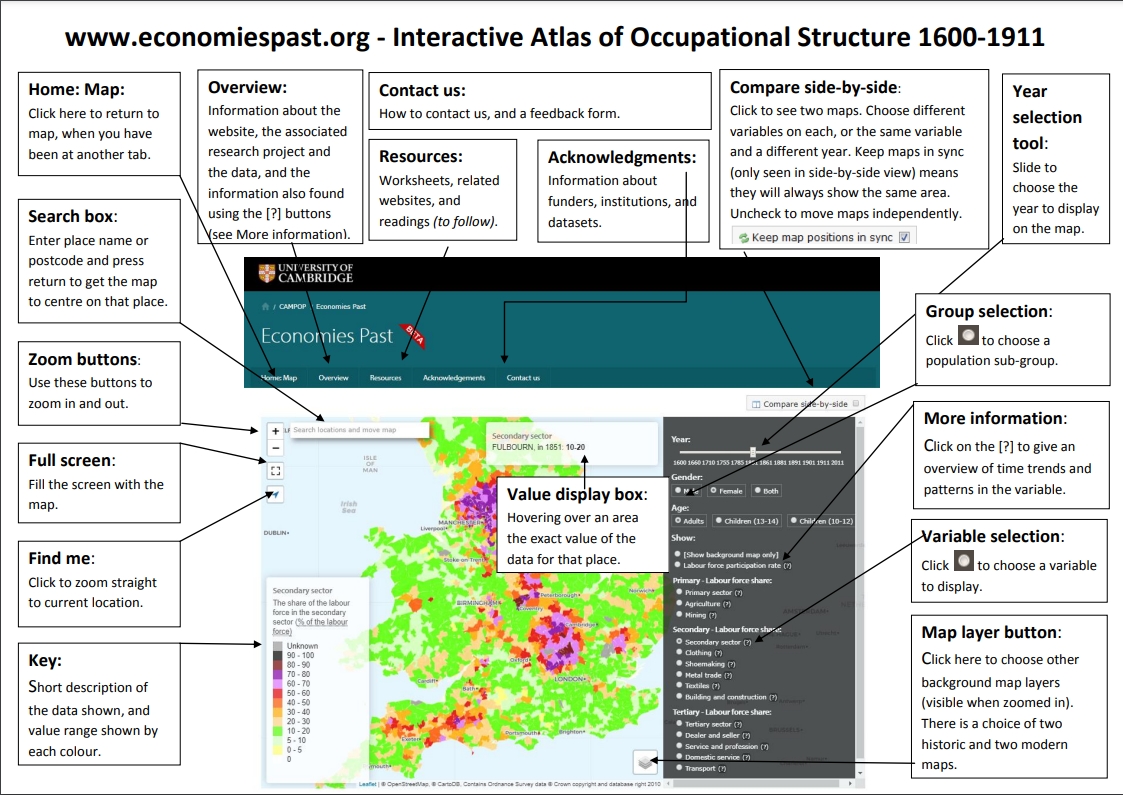
This website allows users to create and view maps of occupational structure across England and Wales from 1600-2011 and to zoom in to examine patterns and change at the local level. Note that you can display two maps side by side and that you have the choice either to hold the areas shown in the two maps the same, or to scroll around the two maps independently. It is also possible to switch the data off and show the underlying map base, which may be useful in helping you to recognise where you are on the map. You can explore 13 different sectors and sub-sectors of employment and also the labour force participation rate. All these measures are defined below and the definitions can also be viewed in pop-up windows accessed by clicking on the question mark after the variable names on the right-hand panel of the interactive maps. You can also choose whether to look at adult males (1600-2011); adult females (1851-2011); all adults (1851-2011); female children aged 10-12 (1851-1911); female children aged 13-14 (1851-1911); male children 10-12 (1851-1911) and male children 13-14 (1851-1911).
It is important to stress that when you look at child and female employment patterns in the 1851-1911 period, you should also look at the labour force participation rate (the proportion of the relevant group in the labour market) because large numbers of women and children were not in the labour market, but the shares of men, women and children in each sector and subsector are always expressed as a proportion of all individuals in the population sub-group who were in the labour market. A single example may make this clear. If you look at male children aged 10-12 in agriculture in 1911, you will see many locations where over 50 per cent of male children in the labour force in this age range were in agriculture. However, if you look at the labour force participation rate for male children 10-12 in 1911, you will see that in most areas, less than ten per cent of boys 10-12 were in the labour force – because, by this date, the vast majority of children of this age were in school. If the labour force participation rate for boys 10-12 in a parish is say 8 per cent and the share of the labour force in agriculture for the same group is 50 per cent, then only 4 per cent of boys in this age range were working in agriculture. All this matters much less when looking at adult males, because reported participation rates between 1851 and 1911 were typically 95 per cent or more.
Link: https://www.economiespast.org/